Overview of Sentinel Visualizer
Free TrialEmpowering the demanding needs of intelligence analysts, law enforcement, investigators, researchers, and information workers, Sentinel Visualizer is the next generation data visualization and analysis solution for your big data.
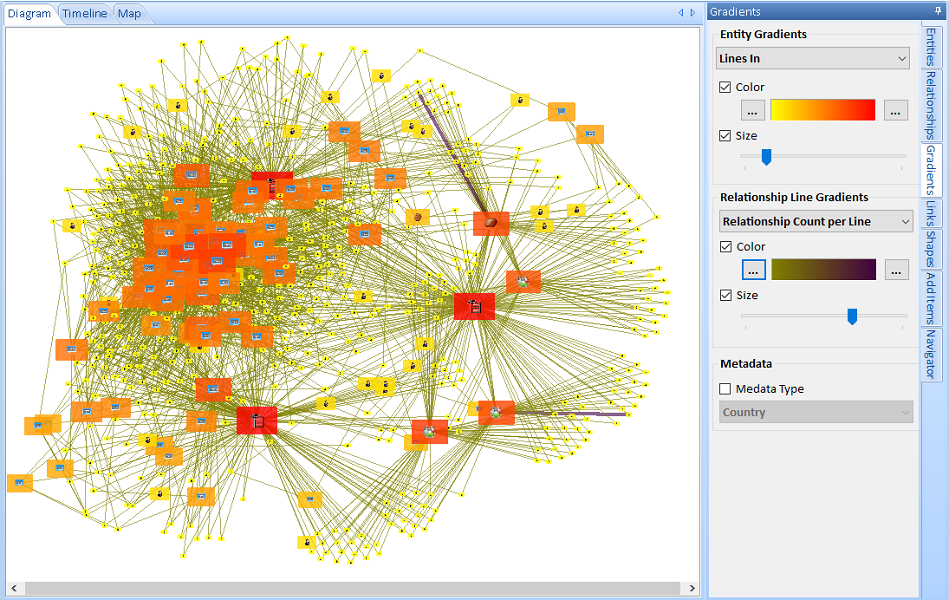
With cutting edge features and best-of-breed usability, Sentinel Visualizer provides you with insight into patterns and trends hidden in your data. Its database driven, data visualization platform lets you quickly see multi-level links among entities and model different relationship types. Advanced drawing and redrawing features generate optimized views to highlight the most important entities.
Social Network Analysis (SNA) metrics reveal the most interesting suspects in complex webs. With advanced filtering, squelching, weighted relationship types, shortest path analysis, timelines, and integrated geospatial features, Sentinel Visualizer helps you maximize the value of your data.
- Integrated knowledgebase, link analysis, social network analysis, geospatial, and timelines
- Industry standard database format with Microsoft SQL Server
- Multi-user support
- Laptop deployable
- Multiple monitor support
- Originally created for the Intelligence Community
- FREE Trial Version
- No Dongle
Turn rows and columns into visual data revealing multi-level hierarchical relationships and hidden links among people, places and events.
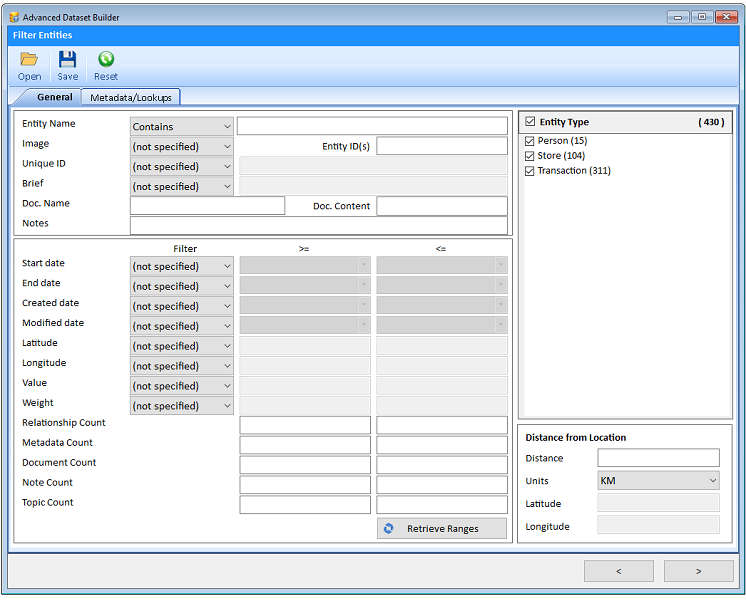
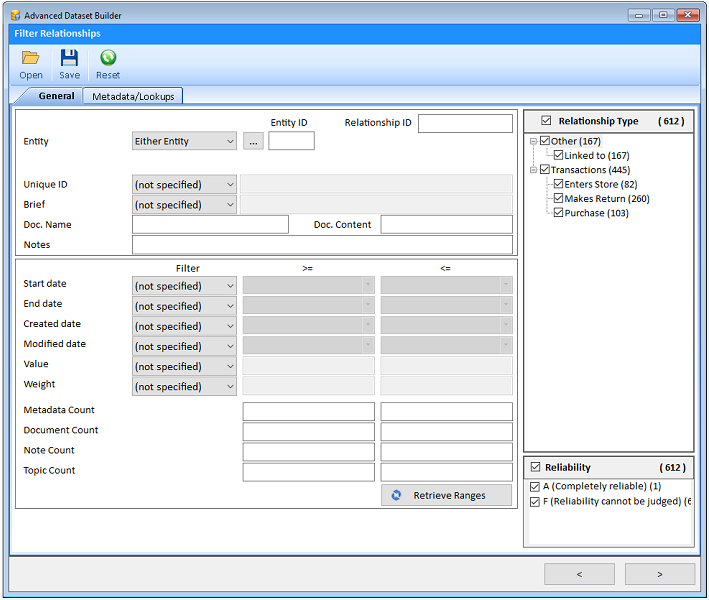
With Microsoft SQL Server, Sentinel Visualizer supports millions of entity and relationship records. Send all your data to the diagram or use search features like the Dataset Builder and Advanced Dataset Builder to select a subset of data for your link chart. Pick entities and relationships by their specific characteristics and links to each other.
You can start big and drill down to details, or expand from individual entities one degree at a time until you include their entire network. Thousands of data points can be added to your diagram in a highly optimized, scalable, and shareable manner.
 "Sentinel Visualizer is robust enough to handle complex and meaningful link and social network analyses over complex data, yet intuitive enough to be immediately accessible. The
new query and data management capabilities, as well as previously unavailable non-enterprise licensing options, make Sentinel Visualizer a competitive alternative to other link analysis products
on the market."
Jonathan Adams
Principal of the Solutions Group at Eastport Analytics, Arlington, VA
"Sentinel Visualizer enables state and local government agencies, police departments, and fusion centers to better analyze data. This in turn leads to high-quality, actionable
intelligence."
Bob Batty
President and CEO of Forensic Logic which manages the data for the Texas law enforcement community
"Sentinel Visualizer represents an innovative use of Microsoft SQL Server and Visual Studio .NET to deliver the next generation data analysis and visualization solutions to
Federal Agencies"
Kris Teutsch
Director of Intelligence and the Department of Homeland Security, Microsoft Corporation, Reston, VA
Sentinel Visualizer provides a variety of automated layout functions that make it easy to quickly organize networks into different configurations. Layouts include incremental, hierarchical, circular, elliptical, rectangular, square, triangular, orthogonal, and force-directed. Entities can also be grouped by their entity type.
Additional options control the entity sort order, multiple network displays, and other customizations.
Entities with latitude and longitude values can be shown automatically on a map with its custom icon. Filter the network view by geographic area or use the Geo-Query to find new data by geographic location.
Sentinel Visualizer includes online maps with topography and road styles, so you can zoom to any part of the world. Also includes integration with Google Earth and support for offline maps, ESRI and shape files. There are settings, and output for printing and graphic export files.
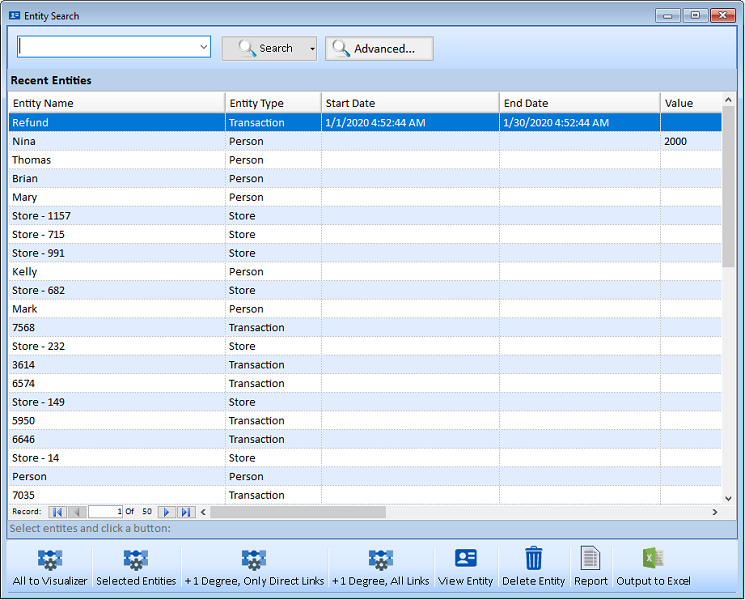
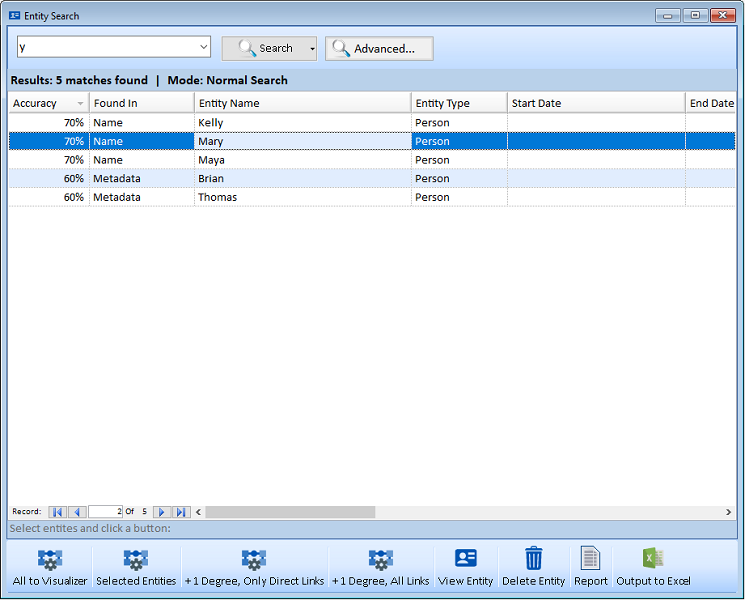
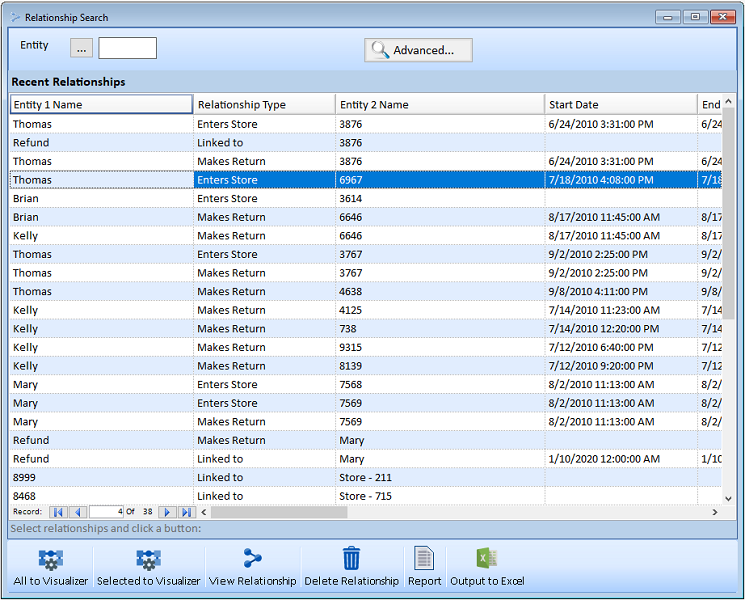
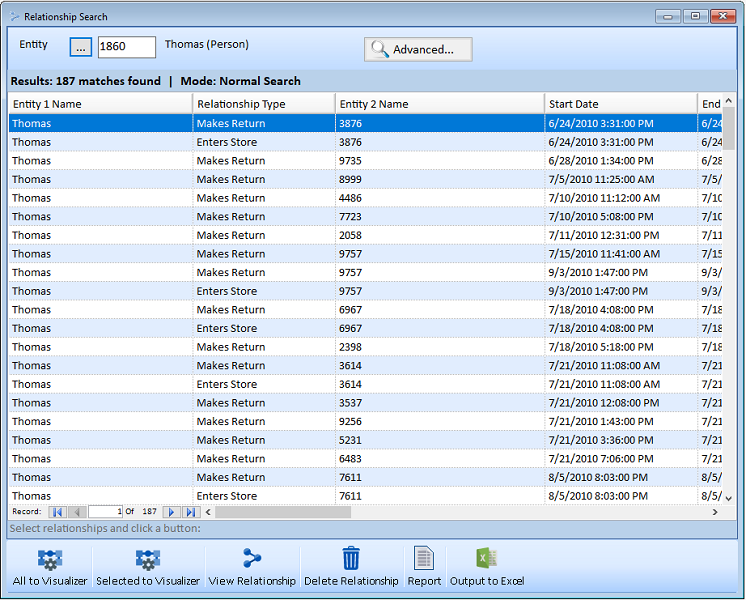
With Microsoft SQL Server potentially storing millions of records, Sentinel Visualizer makes it easy to find the specific entities and relationships you want with simple to advanced search options. Selected items can be viewed in detail, edited, put in reports, exported to Excel, and displayed on a link analysis diagram.
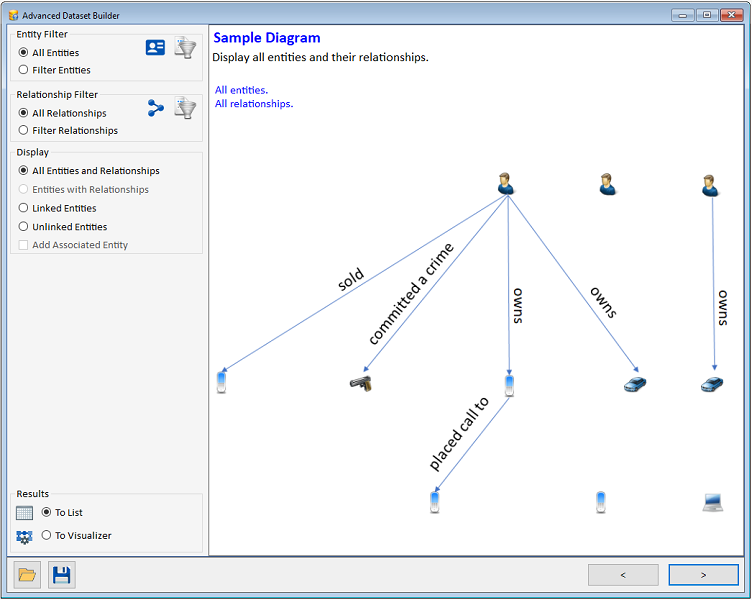
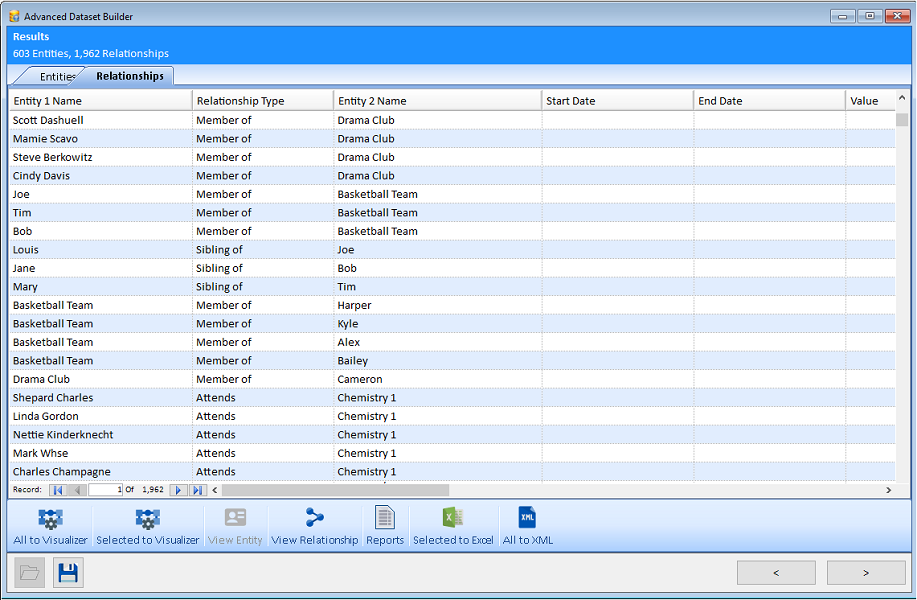
The Advanced Dataset Builder Wizard offers 15 illustrated types of links between entities and relationships combined with the advanced search features to select the desired entities and relationships. Results can be previewed or sent directly to the Visualizer.
Sentinel Visualizer provides timeline views of your data with dynamic time sliders.
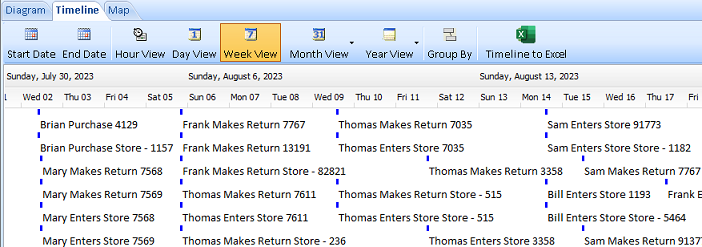
The Timeline view shows all entity and relationship start/end date/time data in a scrollable view, making it easy to see events, overlapping periods, and other time-based patterns. Choose views by Hour, Day, Week, Month and Year to best display your data.
A Time Slider allows you to define a time window, move the Slider back and forth, and see how the network data changes over time.
 Only Sentinel Visualizer gives you a powerful, configurable and scalable knowledgebase in Microsoft SQL Server that makes it easy to store any information:
text, graphics, documents, video, audio, etc. Move beyond simple "cards" with a flexible multi-user data repository that is directly integrated
with visualization and analysis tools. The database can be hosted locally, on a network, and in the cloud.
Microsoft SQL Server supports advanced logins and encryption to protect data at rest. Sentinel Visualizer supports your database security specifications.
- Data visualization capabilities including 2D and 3D link charts and stereoscopic graphs
- Built-in Social Network Analysis and Advanced Network Analysis
- Automated layout tools to organize complex network charts
- Geospatial Integration with Google Earth
- Google Geofencing Analysis
- Detection of network cut-points
- Temporal Analysis
- De-clutter tools to filter out noise and non-credible information
- Advanced tools such as shortest path, all paths, and gradient metrics
- Automated cluster/cell detection
- Supports an unlimited number of databases
- Integrated scalable entity and relationship knowledgebase
- Name disambiguation through aliases and fuzzy searching
- Grading of reliability of source and credibility of information for relationship information
- Built-in support for storing any type of document (binary or text) in the knowledgebase
- Administrator-configurable data types
- Extensible metadata model for complete customization
- Data import wizard for easy integration with many data sources
- Dataset Builder to build complex queries quickly
- Rich reporting exports to Excel, Word, PDF, and HTML
- Export data to industry-standard XML format
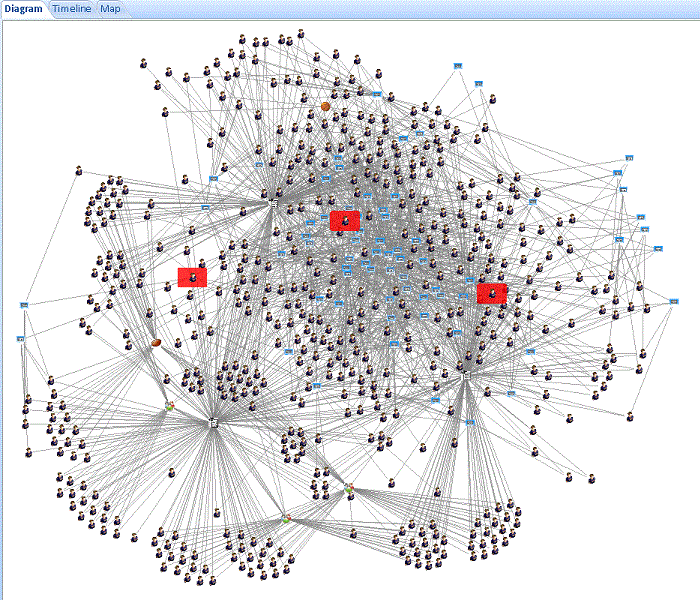
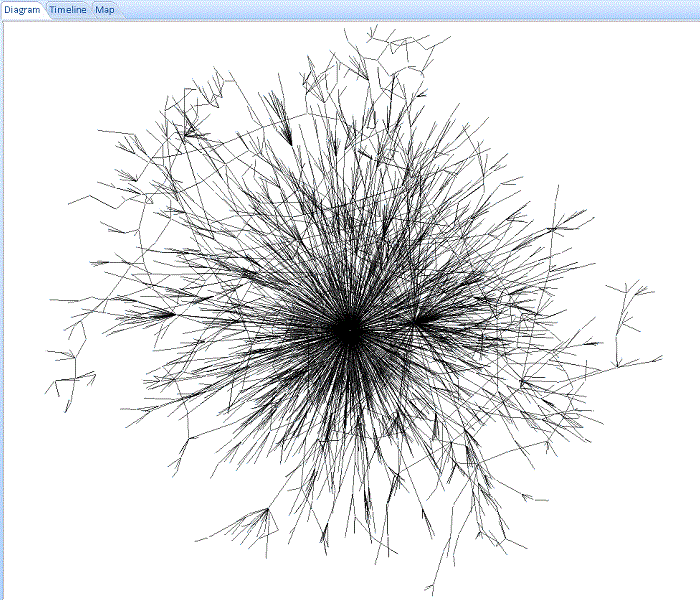
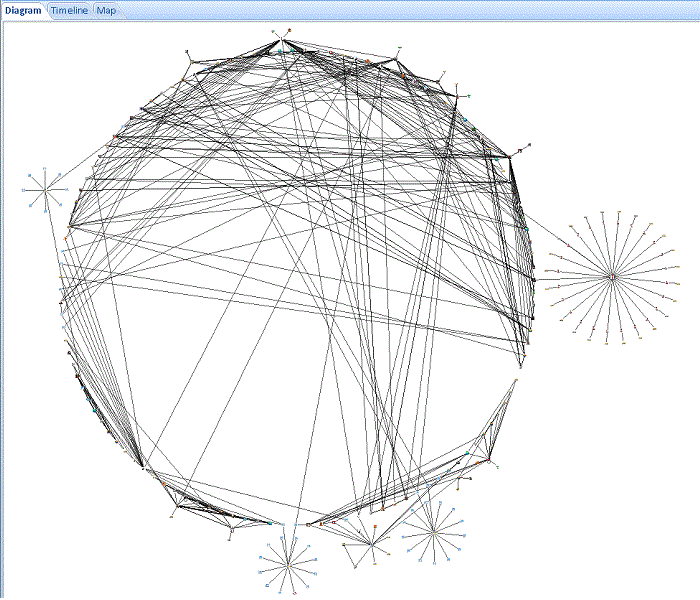
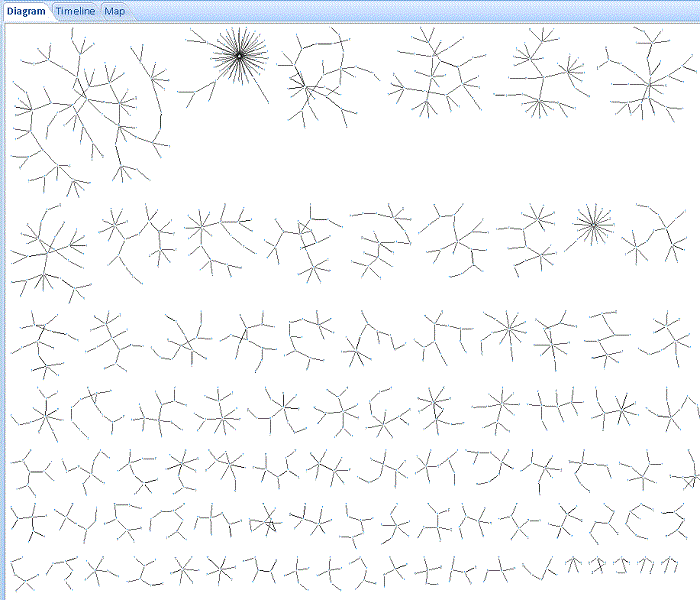

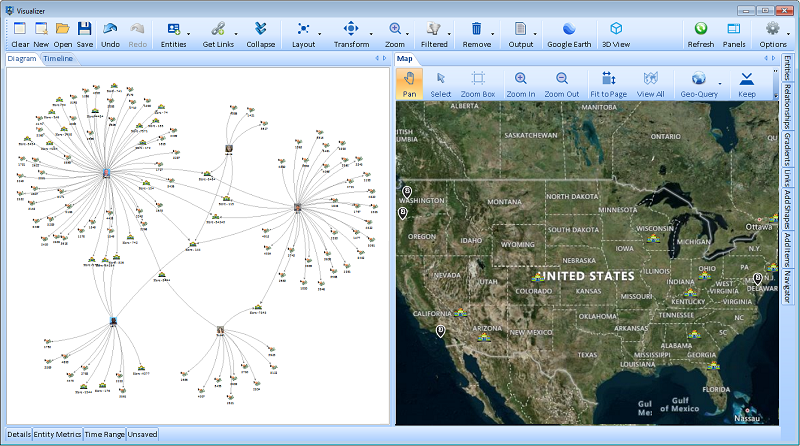

 Sentinel Visualizer maximizes your screens so you can view and analyze your large networks in detail.

