SentVi Reader
allows your link analysis charts to be saved and shared with non-licensed Users.
Reader Overview
SentVi Reader is a FREE, view-only software application that opens data visualization (link analysis) charts created by licensed users of SentVi. Reader Users can view the chart and drill-down to the data behind the chart including metadata, notes, topics, documents, and information on the Brief tab, but they cannot modify the data.
Free Connections to Your Database
Users with permission to connect to your SentVi database can use Reader to open/view saved charts.
Distribute Copies of Your Work to Others
A licensed user can export a link chart to an .SVX file and send that file to non-licensed users. Those recipients can install the Reader for free to open the charts and drill-down to the details behind the charts. Just like Adobe Reader is free and allows you to open a PDF file, SentVi Reader is free and allows you to open an SVX file. The SVX file is a “mini database” that Reader can open but users cannot modify.
Reader Features
SentVi Reader lets you open and view diagrams exported by a licensed Sentinel Visualizer user. A Reader User can:
- View the network diagrams as the creator saved it, including gradients and filters.
- Click on individual nodes and view its details (brief, metadata, topics, and notes).
- Click on individual relationships and view its details (including dates, weight, value, credibility, reliability, metadata, notes, topics, and more).
- Interface to Google Earth for geospatial analysis.
Move objects around the diagram. - Zoom-in and navigate around the diagram using the Navigator tool.
- View the diagram in 3D (Standard and Anaglyph).
- Open a saved diagram directly from a SentVi database (subject to security permissions).
Limitations
SentVi Reader differs from the fully-licensed edition by not supporting:
- Adding and removing items from the Diagram
- Changing the Diagram layout
- Creating reports
- Saving changes
- Applying filters to the data
- Changing gradients or links visualizations
- Internet search from a selected entity
- Administrative tasks like creating databases, making backups, changing passwords, etc.
Note that when a file is distributed, it’s not connected to the live database and the data may become out-of-date.
Download SentVi Reader
Simply have your colleagues click on this link to download and install the FREE SentVi Reader. They can connect to your SentVi database directly if you give them permission or you can send an SVX file to them.
Once downloaded, open Windows File Explorer and right-click on “SentViReader.EXE”. Choose “Run As Administrator”. During the installation process, click “I accept”, Yes, Next, etc., as prompted. Next, launch SentVi Reader
How to create a .SVX Reader File?
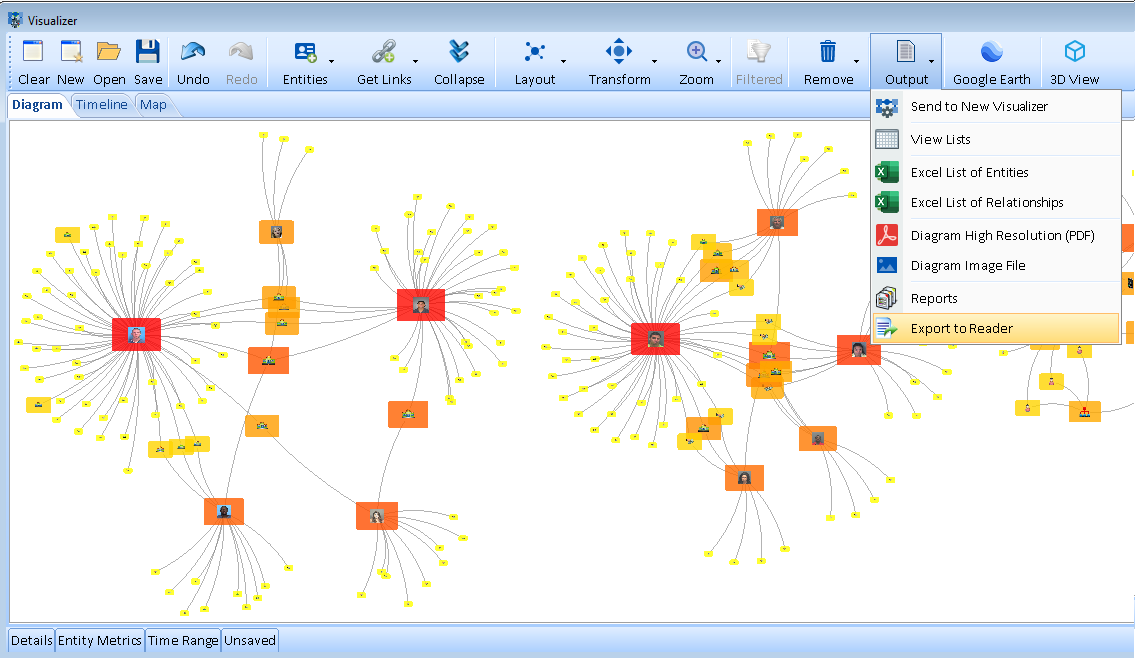
1) From the toolbar of the Visualizer pane in the licensed version, click [Output] and then select [Export to Reader].
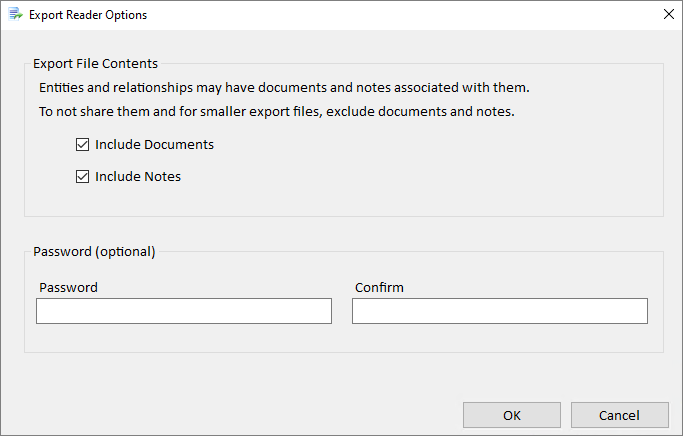
2) The Export Reader Options box opens. This allows the user to choose what content the SVX file contains and add a password for added security.
How to open a .SVX Reader File
Visualizer Window
Entity and Relationship Details
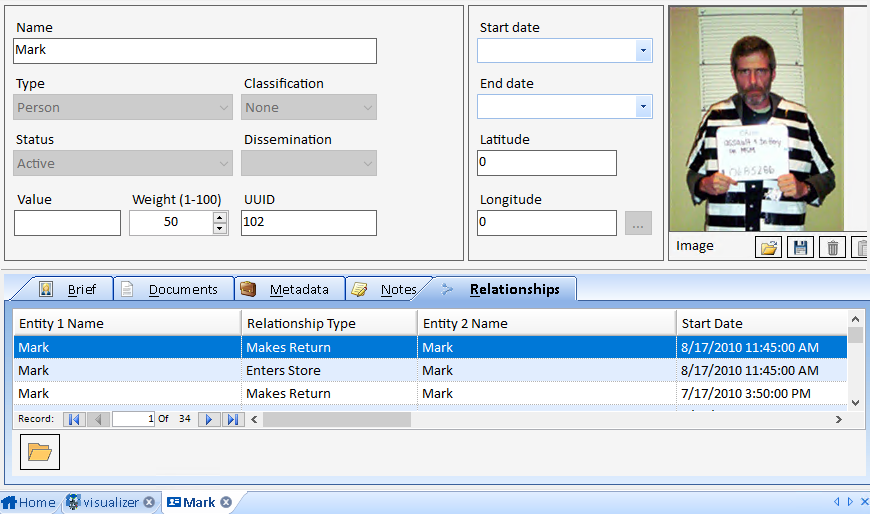
Double-click on an entity or relationship line to open a window with its details (dates, weight, value, credibility, reliability, metadata, notes, topics, and more).
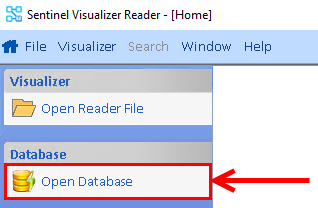
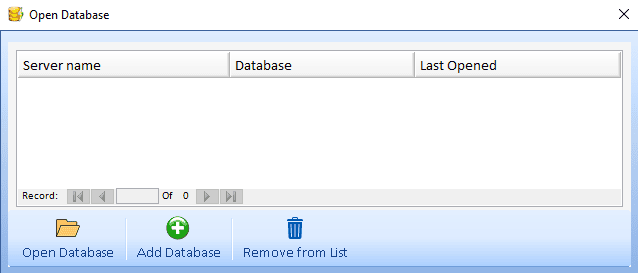
How to open a Database in SentVi Reader
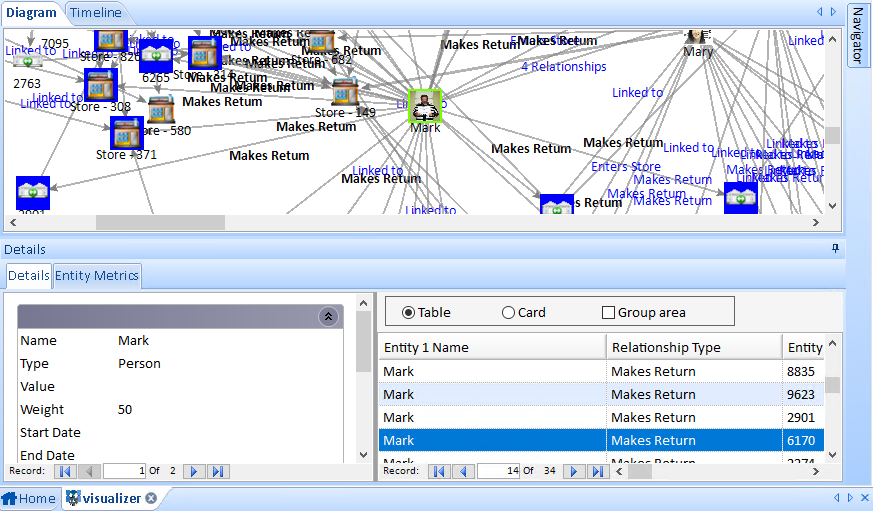
Entity Details on the Bottom Panel
The panel on the bottom has a ‘Details’ tab showing the currently selected entity’s detail and relationships.
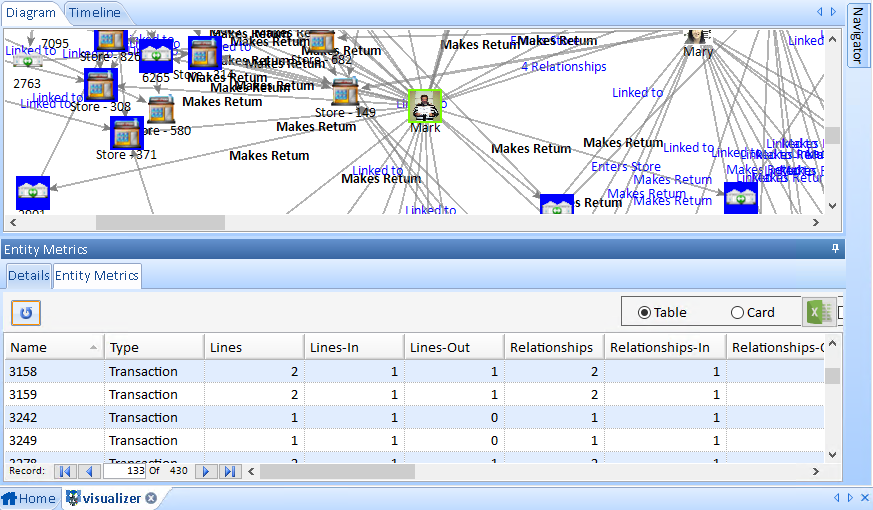
Entity Metrics on the Bottom Panel
The ‘Entity Metrics’ tab lists all the entities, their line counts to other entities, and social network analysis metrics.
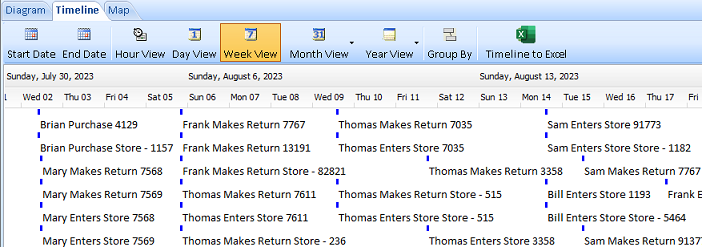
Timeline Tab
If the underlying data contains start and end date data, the ‘Timeline’ displays them with optional groupings by hour, day, week, month and year.