
Layout Options
Quick selection by question
- “Compare many small cases?” Tiled
- “What ties everything together?” One network
- “Which group connects to which?” Multiple circles / Square / Rectangle / Triangular
- “Show peers with equal voice?” One circle / Ellipse
- “Show clean paths/ports?” Orthogonal
- “Where are the clusters/hubs?” Force Directed
- “What’s the chain of command or dependency?” Hierarchical
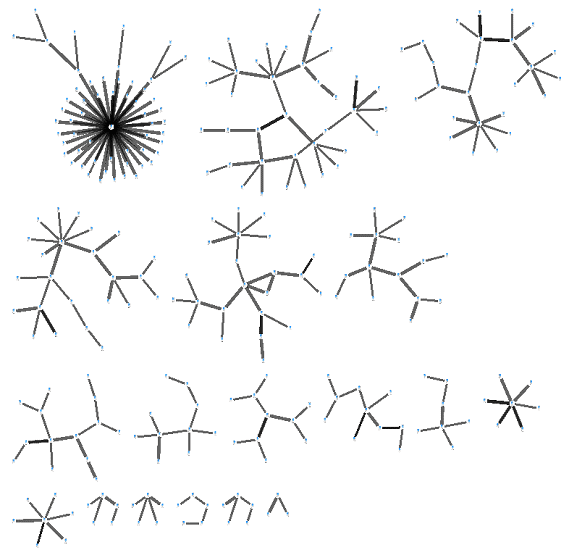
Tiled (default)
Tiled Networks option shows each network sorted by largest to smallest side-by-side in rows.
Structure: Many disconnected components / cases. Examples: Separate investigations, accounts, incidents, patient cases. Why it fits: Clear side‑by‑side comparison; component size/density becomes instantly meaningful.
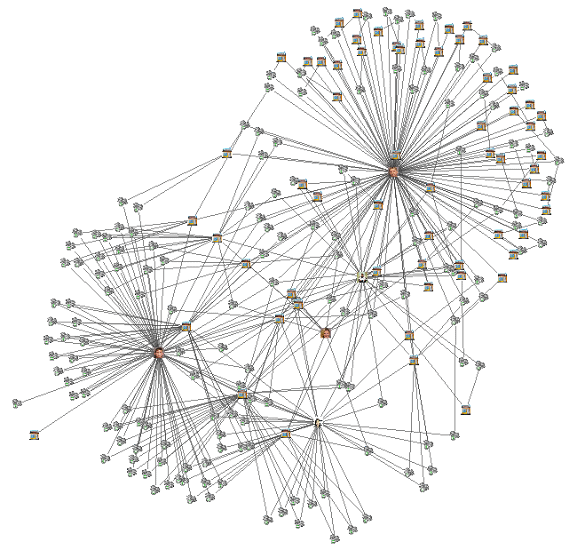
Incremental layout
If you like the results, but not the rotation, use the Transform feature to adjust it. The Tiled and One Network options offers different layouts if your data includes multiple, disconnected sets of entities (networks).
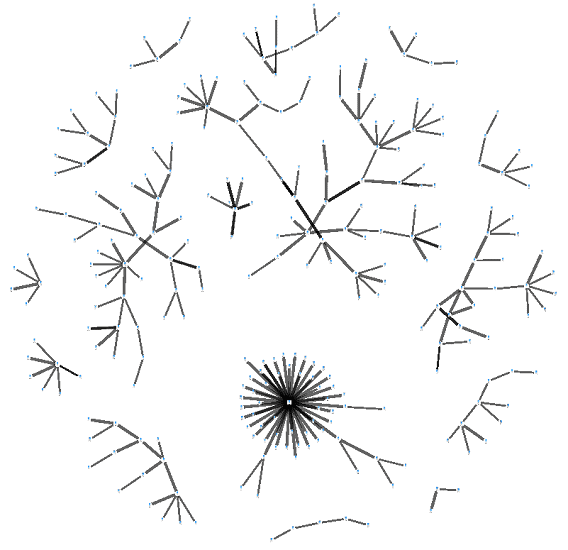
One Network
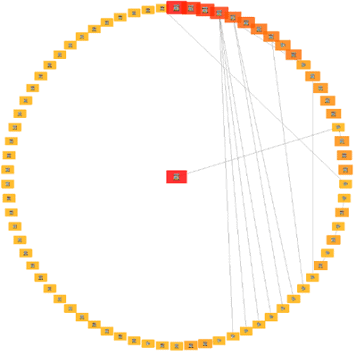
One Circle
Use: The circular layouts are highly effective for identifying central figures in a conspiracy or criminal network. By arranging entities in a circle, it emphasizes nodes with the highest number of connections, pointing to key facilitators or leaders.
Structure: Peer set / equal status entities. Examples: The circular layout is highly effective for identifying central figures in a conspiracy or criminal network. By arranging entities in a circle, it emphasizes nodes with the highest number of connections, pointing to key facilitators or leaders. Why it fits: Chords reveal reciprocity, hubs, and shortcuts while preserving equal prominence.
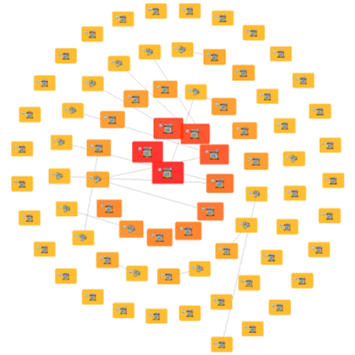
Spiral
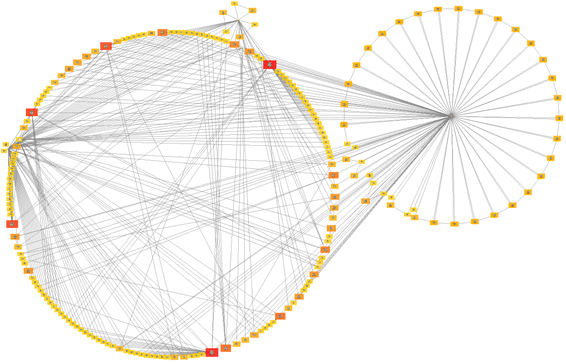
Circular Layout
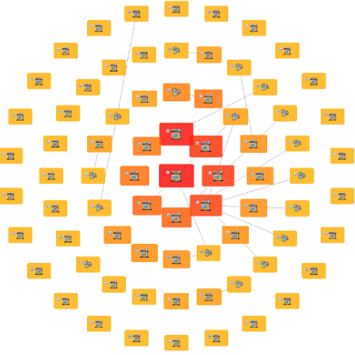
Circle with Center
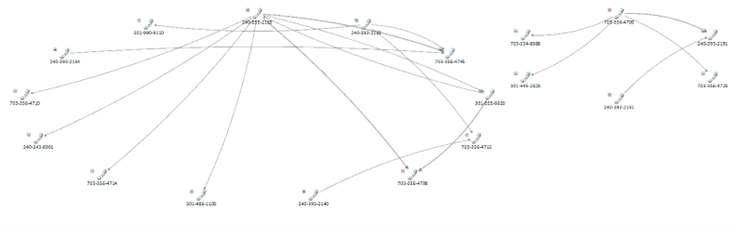
Ellipse
Structure: Circular ordering but labels are long or canvas is wide. Examples: Long‑named business units, ticket titles, legal entities with verbose names. Why it fits: Stretched ring reduces overlap; keeps the perimeter order you want.

Rectangle
Structure: 2‑ or 4‑bucket partitions with uneven aspect ratio. Examples: Internal vs External on long sides; North/South/East/West; Data/Compute/Network/Edge. Why it fits: Longer sides create room for labels and dense relationship segments.
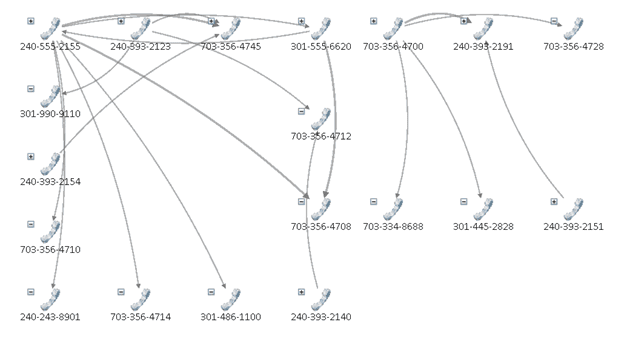
Square
Structure: 4 balanced categories. Examples: People/Places/Organizations/Events; Create/Read/Update/Delete; Risk/Cost/Value/Time. Why it fits: Each side = category; cross‑side relationships highlight interactions.
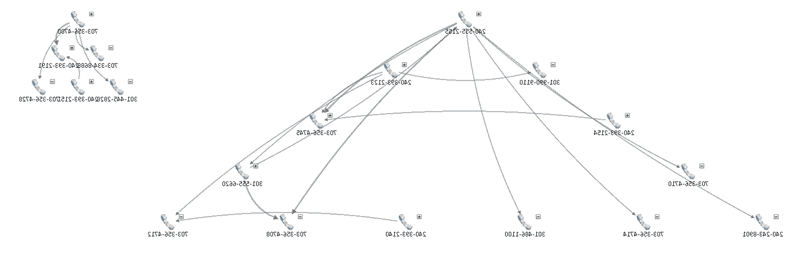
Triangle
Structure: 3‑way partitions / roles. Examples: Source–Broker–Sink, Buyer–Seller–Intermediary, Red/Blue/Green teams. Why it fits: Side assignment conveys role; cross‑side relationships show flows.
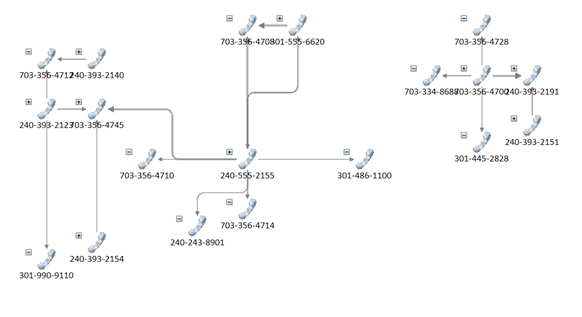
Orthogonal (large)
Use: This is particularly useful for tracking complex financial transactions in a money laundering investigation. Its clean, grid-like structure with 90-degree angles makes it easy to follow the flow of funds between shell corporations and offshore accounts.
Structure: Technical systems with paths that benefit from right‑angle routing. Examples: The Orthogonal layout is useful for systematically comparing the attributes and connections of multiple suspects. By arranging them in a structured grid, analysts can easily spot shared contacts, common locations, or similar methods of operation. Why it fits: Edges avoid ambiguity, creating area for labels and ports.
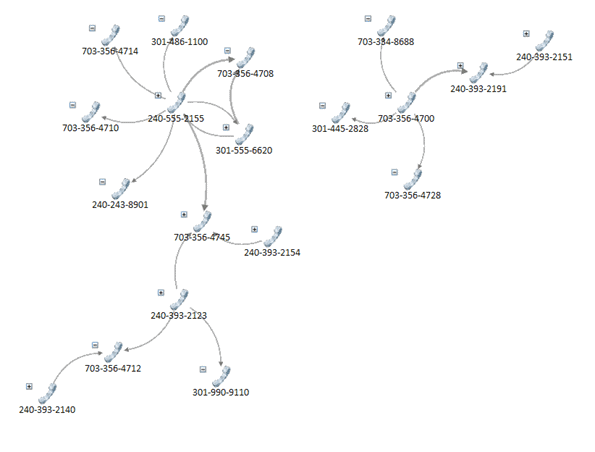
Force Directed
Use: This layout is ideal for the initial exploration of a large, unstructured dataset, such as phone records. It automatically pushes highly connected individuals into clusters, revealing previously unknown cells or groups within a wider criminal enterprise.
Structure: Unknown or organic networks with emergent clusters. Examples: This layout is ideal for the initial exploration of a large, unstructured dataset, such as phone records. It automatically pushes highly connected individuals into clusters, revealing previously unknown cells or groups within a wider criminal enterprise. Why it fits: Proximity and geometry reveal hubs, communities, and bridges without imposing categories.
Hierarchical
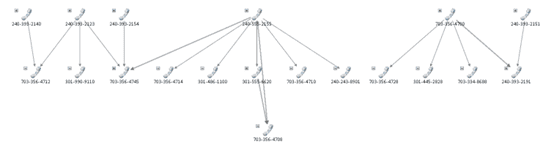
Use: This layout is excellent for mapping the command-and-control structure of a drug cartel or gang. It clearly visualizes the flow of power and communication from the leadership down to the street-level members.
Structure: Flows, chains, trees, DAGs. Examples: This layout is excellent for mapping the command-and-control structure of a drug cartel or gang. It clearly visualizes the flow of power and communication from the leadership down to the street-level members. Why it fits: Directionality and level ordering make parent→child and dependency semantics explicit.